
NetMap transforms raw network flow data into an interactive geographic visualization. See site-to-site traffic arcs, drill into regional clusters, and understand exactly how data moves across your enterprise.
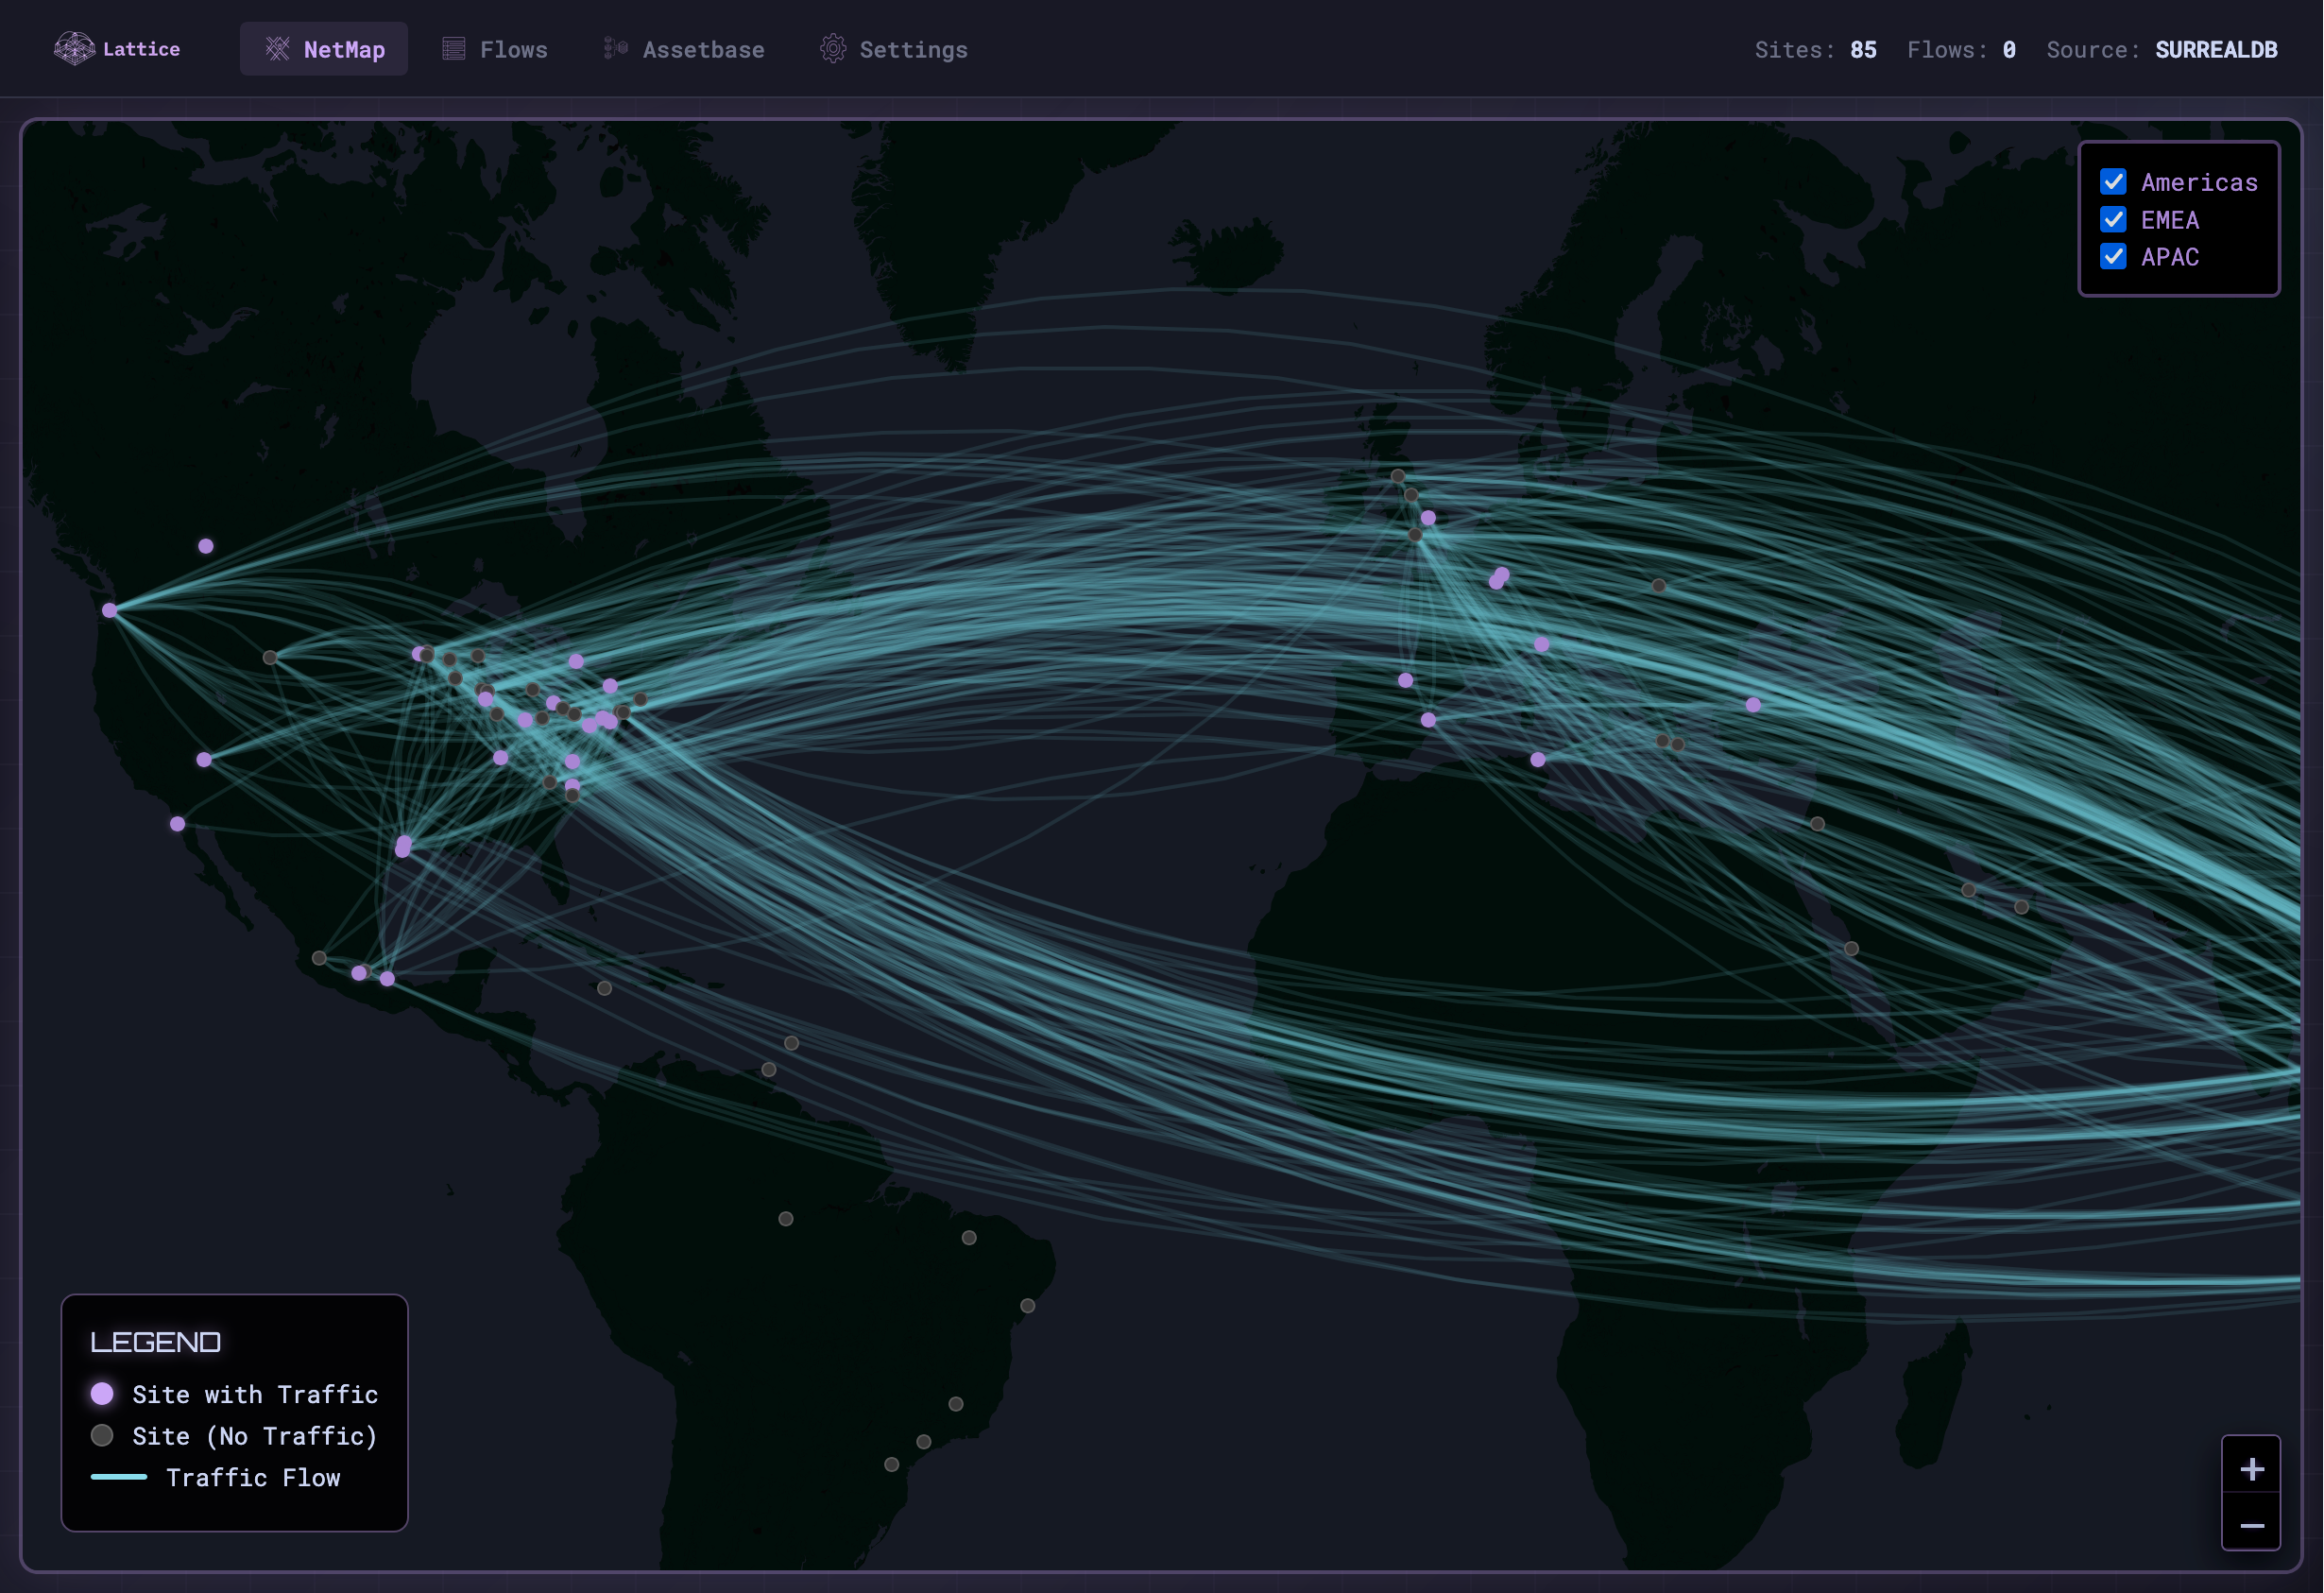
Every site with geo-coordinates appears on the map. Active sites with traffic glow; inactive sites remain dim.
Curved lines connect sites with network traffic. Arc thickness indicates volume; hover for flow details.
Toggle Americas, EMEA, and APAC layers. Focus on specific regions or view the full global picture.
Click any site marker to see flow counts, region info, and a direct link to view all flows from that site.
Header displays total sites, total flows, and data source status in real-time.
Site coordinates sourced from Dragos platform sensors. Automatically synced during data import.
Network flows from Firewall logs or other sources are imported into SurrealDB with source and destination IPs.
Each IP is matched to a site using CIDR mappings. Unknown ranges are flagged for subnet assignment.
Sites are enriched with latitude/longitude from Dragos sensors or manual configuration.
Flows are aggregated by site pair. The map renders markers and arcs using Leaflet.js with Protomaps vector tiles.
Identify unexpected cross-site traffic and validate segmentation policies visually.
Monitor OT site connectivity and ensure plant networks stay isolated.
Plan network changes with full visibility into current traffic patterns.
Present network posture to leadership with an intuitive geographic view.
Launch NetMap and see traffic flows across all your sites.
Back to Home →